Proxmox Grafana Dashboard
InfluxDB
First we have to create a time series database to store the metrics.
Proxmox only supports Graphite and InfluxDB.
I will run InfluxDB via Docker tagged to v1.8 for now.
docker run -d \
--name influxdb \
--hostname influxdb \
--net lan --ip 192.168.1.110 \
-v /etc/localtime:/etc/localtime:ro \
-v /srv/influxdb/data/:/var/lib/influxdb \
-v /srv/influxdb/conf/:/etc/influxdb \
--cpus=".5" --memory="512m" --memory-swap="1024m" \
--restart always \
influxdb:1.8 -config /etc/influxdb/influxdb.conf
To create a default config run influxd.
docker run --rm influxdb:1.8 influxd config > /srv/influxdb/conf/influxdb.confProxmox only supports UDP to send metrics which is not enabled by default.
We create a UDP listener and specify the database name “proxmox”.
cat << 'EOF' >> /srv/influxdb/conf/influxdb.conf
[[udp]]
   enabled = true
   bind-address = "0.0.0.0:8089"
   database = "proxmox"
   batch-size = 10000
   batch-timeout = "60s"
EOF
I disabled the logging of http requests and database queries.
sed -i "s/logging-enabled = true/logging-enabled = false/g" /srv/influxdb/conf/influxdb.conf
sed -i "s/query-log-enabled = true/query-log-enabled = false/g" /srv/influxdb/conf/influxdb.conf
sed -i "s/log-enabled = true/log-enabled = false/g" /srv/influxdb/conf/influxdb.conf
InfluxDB recommends to increase the system UDP buffer.
cat << 'EOF' >> /etc/sysctl.conf
net.core.rmem_max=26214400
net.core.rmem_default=26214400
EOF

sysctl -w net.core.rmem_max=26214400
sysctl -w net.core.rmem_default=26214400
With that InfluxDB is setup.
docker restart influxdb
Proxmox Feed Metrics to InfluxDB
Navigate to “Datacenter -> Metric Server -> Add -> InfluxDB”
# Name: proxmox
# Server: 192.168.1.110
# Port: 8089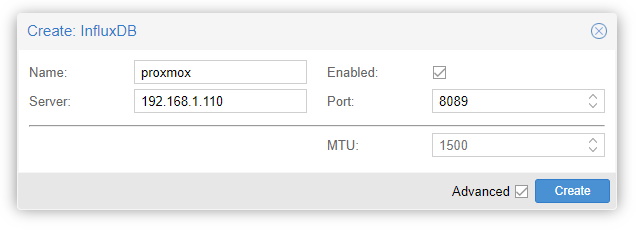
Grafana
docker run -d \
--name grafana \
--hostname grafana \
--net lan --ip 192.168.1.120 \
-v /etc/localtime:/etc/localtime:ro \
-v /srv/grafana/data/:/var/lib/grafana \
-v /srv/grafana/conf/:/etc/grafana \
-e "GF_INSTALL_PLUGINS=grafana-clock-panel" \
--cpus="1" --memory="512m" --memory-swap="1024m" \
--restart always \
grafana/grafana:7.3.4
Grafana does not allow to specify user mappings but uses a user with id 472 by default. So we have to fix some permissions first.
This changed with versions over time so check https://grafana.com/docs/grafana/latest/installation/docker/#migrate-from-previous-docker-containers-versions first.
You can always verify the id with.
docker exec -it grafana idFix volume permissions.
touch /srv/grafana/conf/grafana.ini
chown -R 472:root /srv/grafana/

docker restart grafana
Disable authentication for dashboard viewing.
cat << 'EOF' >> /srv/grafana/conf/grafana.ini
[auth.anonymous]
enabled = true
org_name = Main Org.
org_role = Viewer
EOF
Restart the container to apply changes.
docker restart grafana
Open the Grafana web interface http://192.168.1.120:3000/login
Username and password are “admin”.
You will be asked to change the password next.
Navigate to “Configuration -> Data Sources -> Add -> InfluxDB”
# Name: proxmox
# URL: http://192.168.1.110:8086
# Database: proxmox
Dashboards
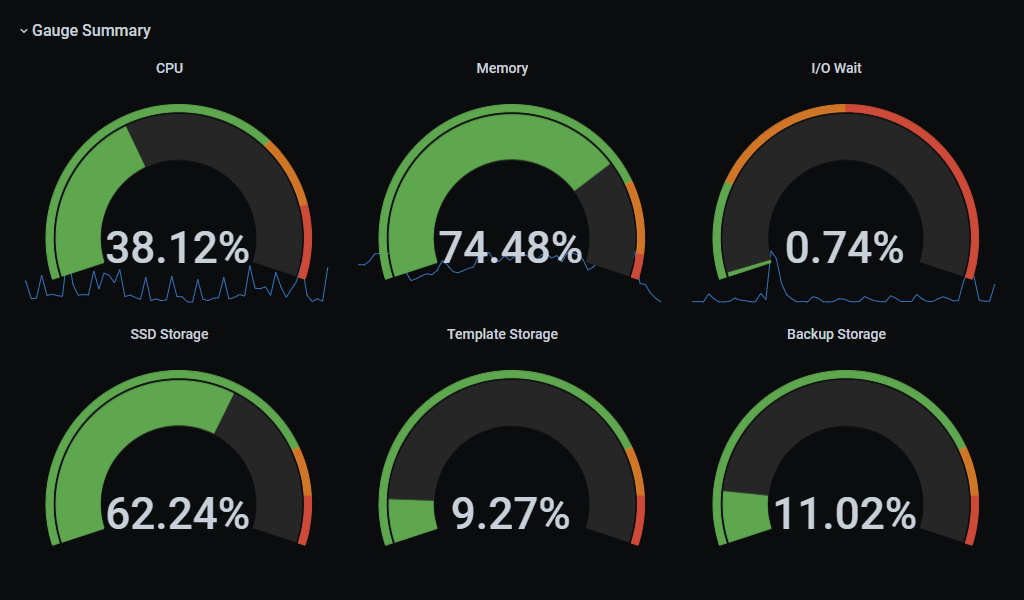
I created several dashboards for Proxmox.
Navigate to “Dashboards -> Manage -> Import -> json”
Kiosk Playlist
Create a playlist for kiosk mode.
Navigate to “Dashboards -> Playlists -> New playlist”
# Name: proxmox
# Interval: 20s
# Dashboards: add all from above
# Order: Host Summary, Hardware Summary, Host CPU and Memory Usage, Virtual Machine Stats, Container Stats
Setup Kiosk
Setup a raspberry pi to show the playlist on a TV.
Write a Reply or Comment